
Customer.io Now Tells You Which Email Clients Your Audience Actually Uses. Stop Quoting the Industry Apple Mail Number

In December 1952, Lieutenant Gilbert S. Daniels published a technical note for the Wright Air Development Center with a question mark in the title: "THE 'AVERAGE MAN'?" The US Air Force had been sizing cockpits, seats and flight suits to the dimensions of the average pilot, and Daniels wanted to know whether that pilot existed.
He had body measurements for 4,063 Air Force flying personnel. He picked ten dimensions—stature, chest circumference, sleeve length, hip circumference and six more—and defined "average" generously, as roughly the middle 30% of the population. Then he started eliminating. Anyone outside the average band on stature was out. Then chest. Then sleeve length.
His result, in his own words: "at the end of 10 steps there was not a single individual remaining who fell within the 'average' range for all measurements." Not one man in 4,063. The Air Force had designed a cockpit for a person who did not exist. The fix, as Arizona State University's Punya Mishra put it in a 2023 essay on Daniels, was adjustable seats, straps and suits instead of one size fitted to the average.
Every lifecycle team we work with is still flying the 1952 cockpit. Ask how much of their open rate is Apple Mail Privacy Protection and you get a number between 55% and 60%, quoted with total confidence, measured on somebody else's list. On 13 July 2026 Customer.io shipped the thing that makes that number unnecessary.
TL;DR:
- Customer.io's Email clients tab shipped on 13 July 2026 in the Analysis section, for premium and enterprise accounts with deliverability analytics. It breaks your opens, human opens and clicks down by email client, with data back to 15 April 2025. It replaces the industry figure most teams quote—Litmus's "roughly 55-60% of all email opens", which Litmus itself hedges as "Studies show that" with no study named.
- Your Mail Privacy Protection exposure is the Apple Mail Protected row, not the sum of the Apple rows. Apple Mail Protected is opens through Apple's proxy; Apple Mail is the app without it.
- The percentages are shares, not rates. Customer.io's docs are explicit that "the percentages in each column add up to 100% across all clients". So "Gmail is 41% of opens" means 41% of your opens came from Gmail, not that Gmail opened 41% of what you sent.
- The read that matters is the gap between a client's Opens share and its Human opens share, and the report only sees emails whose tracking pixel loaded. Open tracking turned off, or a recipient whose consent withholds the pixel, means absent from the data rather than zero—a hole that grows as your consent settings get stricter, which is the correct trade.
You have been quoting somebody else's Apple Mail number
The number in circulation comes, directly or at third hand, from Litmus's Email Client Market Share page. It is a serious dataset. The July 2026 edition is calculated from over a billion opens in Litmus Email Analytics, current as of 1 August 2026, and the top of the ranking is stable enough to plan around. Apple takes 62.26% of tracked opens and Gmail 27.03%, which is why Litmus's own summary says the two "account for nearly 90% of the total market share".
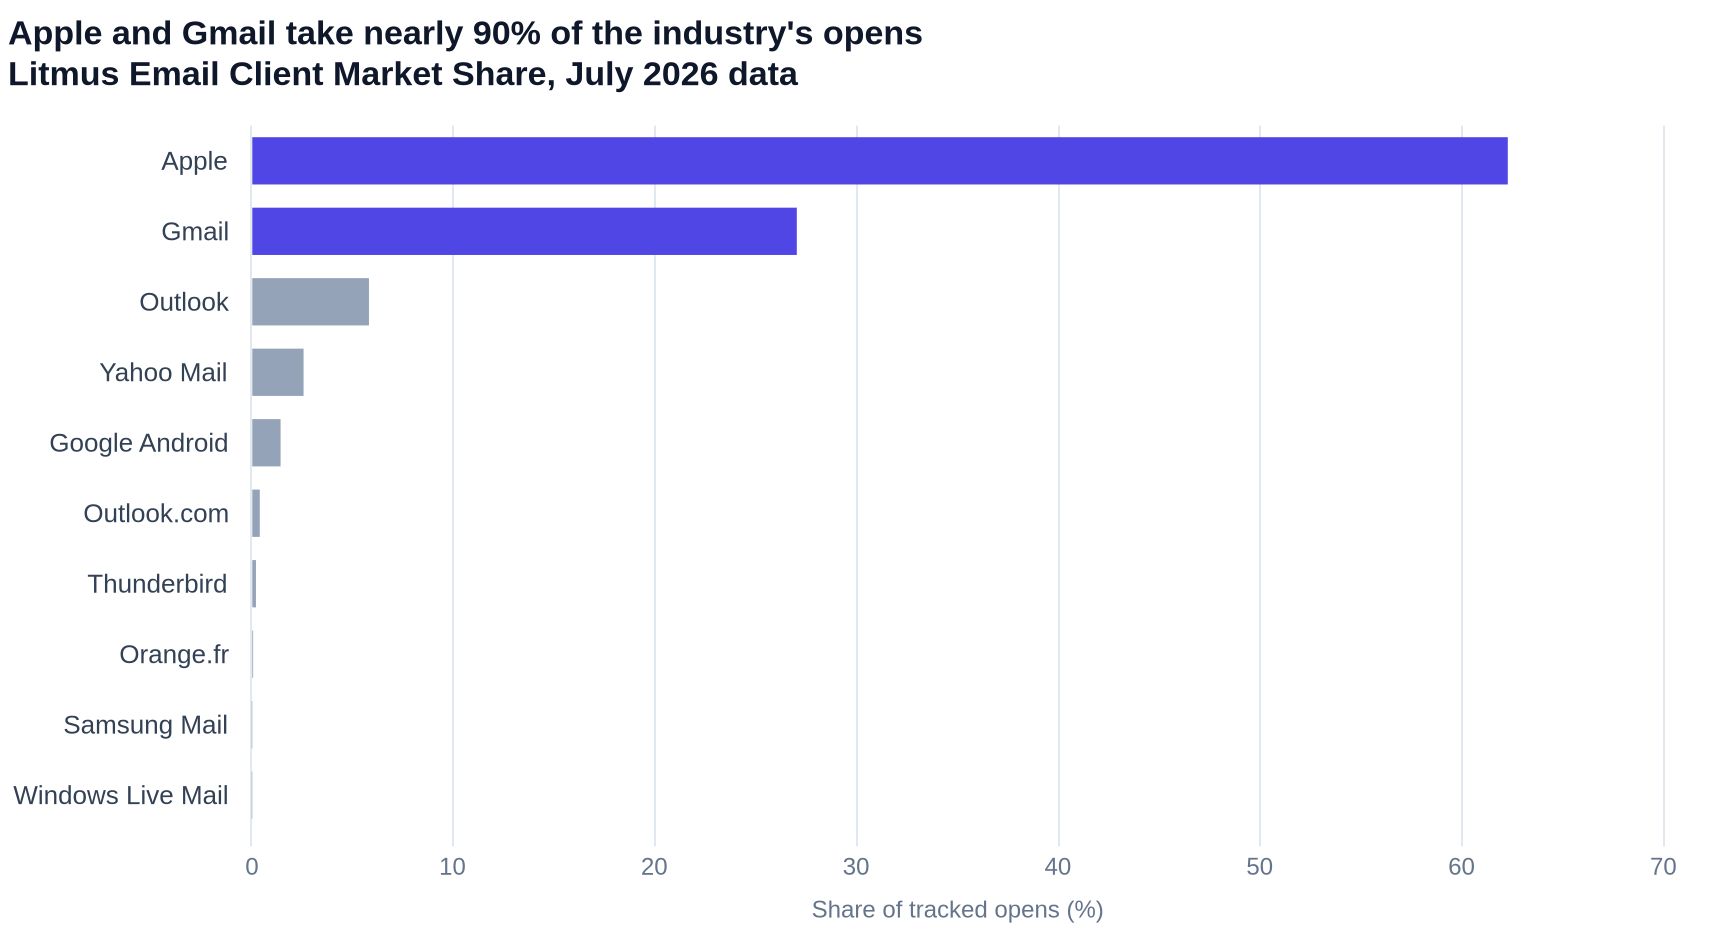
| Client | Share of tracked opens |
|---|---|
| Apple | 62.26% |
| Gmail | 27.03% |
| Outlook | 5.83% |
| Yahoo Mail | 2.59% |
| Google Android | 1.45% |
| Outlook.com | 0.42% |
| Thunderbird | 0.23% |
| Orange.fr | 0.09% |
| Samsung Mail | 0.02% |
| Windows Live Mail | 0.02% |
Now the part nobody reads before quoting it. On the same page, in the key-takeaways block rather than the measured dataset, sits the sentence everyone actually repeats: "Studies show that Apple's MPP now impact roughly 55-60% of all email opens." No study is named. The hedge is Litmus's, not ours, and it is honest of them. But it means the load-bearing number in most CRM board decks is an unsourced range from a takeaways box, applied to a list it was never measured on.
Your list is not the market. A UK B2B SaaS product sold to engineering teams skews to Gmail and desktop Outlook. A consumer wellness brand with an iOS app skews far harder to Apple than 62.26%. Both teams quote the same 55% to 60%, and at least one of them is badly wrong.
The tab is in Analysis, and only premium and enterprise have it
The Email clients tab lives in the Analysis section of your workspace, alongside Deliverability. Customer.io's docs on email client metrics describe what it covers plainly. The tab "shows which email clients your audience uses to read your emails", and "these metrics represent all outbound emails from your workspace over a timeframe you select".
Check your plan before you go looking. The 13 July release note gates it as available "to premium and enterprise accounts with access to deliverability analytics", and the docs page carries a shorter premium-feature callout naming the premium and enterprise plans. On any plan below premium, the tab is not there. Our post on plan tiers covers what each level includes.
That does not leave lower tiers with nothing. The human opened metric has been available for emails opened since 20 March 2025, and human clicked for tracked links since 20 April 2025. You cannot split them by client without the tab, but you can compare your open rate to your human open rate across a whole broadcast, which gives you a workspace-level proxy for proxy inflation. It is a blunter instrument, and it is still yours rather than borrowed.
Apple Mail Protected is not Apple Mail
This is the single most important row-reading rule in the report, and the one most likely to be got wrong in the first week.
The table splits Apple into two rows, and the docs define them precisely. Apple Mail Protected "represents opens through Apple's Mail Privacy Protection proxy, which hides the reader's real client and preloads images automatically". Apple Mail "represents opens from the Apple Mail app without that proxy".
Your Mail Privacy Protection exposure is the first row. Only the first row. Apple Mail without the proxy is a normal client whose opens mean roughly what opens have always meant—a human being had the message on screen with images loading. Sum the two and you have inflated your own exposure estimate, which is a strange way to fix a problem caused by an inflated estimate.
The distinction also tells you something the industry aggregate cannot. Litmus counts Apple as one bucket "including Mail Privacy Protection". Customer.io splits it. So the moment you open this tab you have a figure the aggregate does not offer you at all: the proportion of your Apple audience that is behind the proxy versus in front of it.
If Mail Privacy Protection is new to you as an operational problem rather than a statistic, that post covers what it did to behaviour-triggered journeys. The short version: Apple pre-fetches the tracking pixel whether or not anyone reads the message, so email_opened fires for a large share of your list regardless.
The table is shares, not rates
Three columns: Opens, Human opens, Clicks. Each shows a percentage per client, and "under each percentage, you'll see the raw count of events for that client". And here is the sentence to read twice, from the docs: "Each column represents a different metric, and the percentages in each column add up to 100% across all clients."
They are shares of your total, not rates.
So a Gmail row reading 41% in the Opens column means 41% of your opens came from Gmail. It does not mean Gmail recipients opened 41% of what you sent them. Nothing in this table is a denominator over sends. If you screenshot a row into a deck captioned "Gmail open rate 41%", you have invented a number, and it will be repeated back to you in a quarterly review six weeks later.
The reason this misread is so easy is that the tab sits in the same navigation as reports that are rates. Customer.io was clear about it in the docs; the interface simply puts share-of-total percentages in a place where your eye expects rate-of-send percentages. Slow down for one screen.
The read that matters: Opens against Human opens
Neither column tells you much alone. The information is in the difference between them, client by client.
Human opens are defined narrowly. The docs describe the column as "the percentage of human opens—opens we attribute to real people rather than bots, scanners, and prefetching—that came from the client". The metric itself "excludes emails opened by Apple's Mail Privacy Protection, Gmail's prefetching of images, user agents identified as bots, and known scanners".
That gives you a clean piece of arithmetic. Because both columns sum to 100%, a client's two percentages are directly comparable. A client with a large share of Opens and a much smaller share of Human opens is contributing machine events to your top line. A client whose two shares are close is behaving like a room full of people.
Here is the shape. The numbers below are invented round figures, not a real workspace, because per-client human-open data is nobody's to publish—read them as a worked example of the arithmetic:
| Client (worked example, not real data) | Share of Opens | Share of Human opens | Read |
|---|---|---|---|
| Apple Mail Protected | 48% | 1% | Machine volume. Human opens exclude proxy pre-fetches by definition, so this row all but vanishes in the second column. |
| Gmail | 30% | 55% | Badly under-represented in Opens. This is where your readers actually are. |
| Apple Mail | 12% | 25% | Real engagement, no proxy in the way. |
| Outlook | 8% | 19% | Real engagement, and probably where your rendering bugs live. |
| Bot | 2% | 0% | Not a client. Automated systems identifying themselves. |
| Total | 100% | 100% | Both columns are shares of your total, so they each sum to 100%. |
Illustrative figures for the arithmetic only. Your own table will look nothing like this.
Read that table and the conclusion is not "our open rate is fake". It is "48% of our open volume comes from one row that cannot tell us whether anybody read anything, and the audience we are actually writing to is mostly in Gmail." Those are two different decisions: one about reporting, one about design.
The docs give the reporting instruction directly: "If a large share of your opens come from Apple Mail Protected, your overall open rate overstates real engagement, and you should lean on human opens and clicks for these clients instead."
This is the same lesson as a metric that doesn't mean what it says on the in-app side, where Customer.io counts an in-app message as opened the moment it displays. Same trap, different channel: the word on the label describes an event the system can see, not the human act you care about.
The report cannot see anything the tracking pixel misses
Client identification is not magic. The docs are direct about the mechanism: the client "requests the email's images—including our tracking pixel—and identifies itself in that request". When that request does not name a known app, Customer.io falls back.
| Layer | What it contains |
|---|---|
| Named clients | Gmail, Yahoo, Apple Mail, Outlook (desktop versions and iOS), Thunderbird, Samsung Mail, Superhuman, AOL Desktop, Lotus Notes, Postbox |
| Device and browser fallbacks | iPhone, iPad, Android, BlackBerry, Windows Phone, Windows Browser, Mac Browser |
| Attribution buckets | Bot for automated systems that identify themselves as bots; Unknown for opens Customer.io cannot categorise at all |
| Absent entirely | Any email whose tracking pixel never loaded |
That last row is the one to sit with. The docs put it in two sentences: "Emails that don't include the tracking pixel don't appear in this breakdown. This applies to messages with open tracking turned off and to contacts whose open-tracking consent withholds the pixel."
Absent is not zero. A recipient who never loads the pixel does not show up as a client with a low share—they are outside the dataset. Which means this report is a census of the subset of your audience that loads images, and the subset is shrinking by design.
Two days before the Email clients tab shipped, on 11 July 2026, Customer.io released open-tracking consent, announced in the release note of that date. It gives you three things. A workspace setting to track opens for everyone, everyone who has not explicitly opted out, or only people who opt in. A per-contact cio_email_tracking_consent attribute. And a hosted consent page recipients can use themselves. That release exists because France's CNIL rule took effect on 14 July 2026.
So the two features ship two days apart and pull in opposite directions. Every recipient who withholds consent, and every message you send with open tracking off, leaves the Email clients report. Move your workspace to opt-in and the report gets thinner every month.
That is not a reason to keep tracking everyone. It is a legal requirement that happens to shrink a sample, and shrinking the sample is the right trade—you cannot buy statistical coverage with a compliance breach. What it does mean is that you should date every client breakdown you circulate, and stop treating a figure pulled in August as valid in November. Write down the sample you measured on.
Three more limits to know before you present this
Data starts on 15 April 2025. The docs are explicit: "Data is available from April 15, 2025 onward." There is no pre-2025 baseline, so "our Apple share has doubled since 2023" is not a claim this tab can support. If you need a longer arc, the Litmus series is the honest comparison, with the honest caveat that it is a different population.
Daily numbers follow your workspace timezone. "When you look at daily rates, the numbers align to your workspace's timezone." If your workspace is set to UTC and your team reads in Pacific, your day boundaries are not their day boundaries, and a Tuesday spike may be a Monday evening send.
Small clients disappear into Other in the charts. Clients with small shares in the selected time frame are grouped into Other in the donut and stacked-bar views. The table itself has a search box and sortable columns, so the client is still findable—just not visible in the picture. If you are chasing a rendering complaint from one customer on Thunderbird, search the table rather than squint at the chart.
Use it to pick which clients you design and test in
The tab is a design instrument that happens to fix a reporting problem. Both jobs, in order.
Pick the two or three clients you build and test in. This is the question the data is actually for. Customer.io's stated purpose for the tab is helping you decide which clients to focus on when designing emails. Take your Human opens column, not your Opens column, and let the top three set your QA matrix. If Gmail and Outlook carry your real readers, that is where designing for specific clients earns its keep, because those two are also the clients that force dark mode on colours you did not choose. Test there before you press send.
We rebuilt email for Bikinilists, the UK creative-industry database, on exactly this logic: a plain-text approach beat the graphics-heavy original and lifted click-through rate by 140%, past statistical significance and sustained across campaigns. That decision is much easier to make when you can see which rendering environments your readers are actually in.
Set your own Mail Privacy Protection number, then retire the industry one. Read your Apple Mail Protected share of Opens. That is your exposure. Write it in the doc, with the date range and the note that it only covers pixel-loading recipients, and never quote a range from a takeaways box again.
Decide which reports switch to human opens and clicks. If Apple Mail Protected dominates your Opens column, your headline open rate is a proxy for Apple's behaviour, not your audience's. Swap it out at the top of your reporting for human opens and clicks. That is the same argument we made in what to report instead, now with a way to prove it on your own numbers instead of on principle.
Add it to a routine, monthly rather than weekly. Client mix moves slowly. Bolt it onto the Monday reporting routine once a month, and check the Deliverability tab while you are there. The same 13 July release added a daily send volume chart with bounce and spam complaint rates—the companion view for anything the client mix makes you suspicious about.
One honest caveat on the whole exercise. If your programme sends fewer than a few thousand emails a month, a client breakdown will be noisy, and the difference between 8% and 11% Outlook is not a signal worth a design decision. Read it quarterly, look at the top two rows, and ignore the tail.
If you want a second pair of eyes on what your client mix means for how your programme is built and reported, that is the sort of work our email marketing consulting covers. Tell us what your reporting currently claims and we will tell you what your own data says instead.
Frequently asked questions
What does "Apple Mail Protected" mean in Customer.io's email client report?
Apple Mail Protected is opens that arrived through Apple's Mail Privacy Protection proxy. Customer.io's docs define it as opens "through Apple's Mail Privacy Protection proxy, which hides the reader's real client and preloads images automatically". It is a separate row from Apple Mail, which is the Apple Mail app without the proxy. Treat only Apple Mail Protected as your Mail Privacy Protection exposure.
Do I need Premium to see email client metrics in Customer.io?
Yes. The 13 July 2026 release note gates the Email clients tab to "premium and enterprise accounts with access to deliverability analytics", and the docs page carries a premium-feature callout naming the premium and enterprise plans. On any plan below premium the tab does not appear. You can still compare open rate against human open rate at workspace level, which gives you a rough proxy-inflation read without the per-client split.
Why don't the percentages in the Email clients table look like open rates?
Because they are not rates. The docs state that "the percentages in each column add up to 100% across all clients". Each figure is that client's share of your opens, human opens or clicks, not the proportion of messages that client opened. A Gmail row of 41% in the Opens column means 41% of your opens came from Gmail.
How far back does Customer.io email client data go?
To 15 April 2025. The docs say "Data is available from April 15, 2025 onward", and the 13 July 2026 release note repeats the same date. There is no earlier baseline in the tab, so any year-on-year comparison before mid-2025 has to come from an external dataset with a different population.
Why is a chunk of my opens showing as Unknown?
Unknown is an attribution failure bucket, not a client. The docs describe it as opens Customer.io "can't categorize at all". The tab identifies clients from the tracking pixel request, and when the request carries nothing usable the open still counts but cannot be named. A large Unknown share is a reason to read the rest of the table cautiously, not a client to design for.
What's the difference between Bot and Unknown in the email clients table?
Bot covers "automated systems that identify themselves as bots"—the machine told Customer.io what it was. Unknown covers opens Customer.io cannot categorise at all. Bot is a successful identification of a non-human; Unknown is a failed identification of anything. Neither is an audience segment.
Does turning on open-tracking consent break my email client reporting?
It shrinks the sample rather than breaking it. Customer.io's docs state that emails without the tracking pixel "don't appear in this breakdown", including messages with open tracking turned off and "contacts whose open-tracking consent withholds the pixel". The 11 July 2026 consent release lets you track opens for everyone, everyone who has not opted out, or only opt-ins. The stricter your setting, the smaller and less representative the client breakdown. That is the correct trade: France's CNIL rule took effect on 14 July 2026, and you cannot buy statistical coverage with a compliance breach.
How should I judge how much Mail Privacy Protection is affecting my open rate?
Use your own Apple Mail Protected share of the Opens column over a defined date range, and compare it with that client's share of the Human opens column. The gap is your inflation. Do not use an industry figure. Litmus's widely quoted 55% to 60% claim is hedged on its own page as "Studies show that" with no study named, and it was measured across the whole market rather than your list. Record the date range and note that the figure only covers recipients whose tracking pixel loaded.
Which email clients can Customer.io identify by name?
The docs list Gmail, Yahoo, Apple Mail, Outlook (desktop versions and iOS), Thunderbird, Samsung Mail, Superhuman, AOL Desktop, Lotus Notes and Postbox. When the specific app cannot be identified, Customer.io falls back to a device or browser category: iPhone, iPad, Android, BlackBerry, Windows Phone, Windows Browser or Mac Browser. Bot and Unknown catch the remainder.
Where is the Email clients tab in Customer.io?
In the Analysis section of your workspace, as a tab alongside Deliverability. It shipped on 13 July 2026 and covers all outbound email from the workspace across whatever date range you pick with the calendar in the upper right.
Can I see email client data for a single automation or broadcast?
Not in this tab. The docs say the metrics "represent all outbound emails from your workspace over a timeframe you select", so the breakdown is workspace-wide rather than per-message. The closest approximation is narrowing the date range around a single large send, which works only if nothing else went out in the same window.
Does the Email clients tab tell me about dark mode usage?
No. The tab reports clients, not rendering settings, so it cannot tell you who is reading in dark mode. What it does tell you is which clients to worry about, and Gmail and Outlook are the ones that force dark mode on colours you did not choose. For an industry figure, Litmus's market-share page puts dark mode at "over 25% of the total user base".
Should I still report open rate at all?
Keep it as a diagnostic, drop it as a headline. Open rate still catches deliverability collapses and subject-line disasters, but as a top-line engagement number it is measuring Apple's proxy behaviour as much as your audience's interest. Human opens and clicks belong at the top of the report; raw open rate belongs in the appendix next to the note explaining what it now includes.
Sources
- Email client metrics, Customer.io Docs, updated 17 August 2026. Column definitions, the Apple Mail Protected split, share-not-rate behaviour, client identification and fallbacks, the 15 April 2025 start date, pixel dependency, timezone alignment, Other grouping.
- See which email clients your recipients use, Customer.io release notes, 13 July 2026. Ship date, plan and deliverability-analytics gate, the Deliverability tab's new daily send volume chart.
- Honor your audience's consent for email open tracking, Customer.io release notes, 11 July 2026. The three consent modes, the
cio_email_tracking_consentattribute, the hosted consent page, and the 14 July 2026 CNIL effective date. - Email and messaging metrics, Customer.io Docs, updated 18 August 2026. Definitions of
human openedandhuman clickedand their 20 March 2025 and 20 April 2025 availability dates. - Email Client Market Share, Litmus, July 2026 data, current as of 1 August 2026, calculated from over one billion opens in Litmus Email Analytics. The per-client shares, the "nearly 90%" combined figure, the hedged 55% to 60% Mail Privacy Protection claim, and the dark mode figure. Cited and linked as Litmus asks.
- THE "AVERAGE MAN"?, Gilbert S. Daniels, WADC Technical Note 53-7, Wright Air Development Center, December 1952. The sample of 4,063 men, the ten dimensions, the middle-30% definition, and the finding that nobody remained.
- Opinion: Gilbert Daniels, the gardener who changed our world, Punya Mishra, Arizona State University, 20 April 2023. Independent account of the study and the shift to adjustable equipment.
Want this working in your Customer.io workspace?
It's what we do all day for SMBs—strategy, automations, deliverability and hands-on execution.
See how we work as a Customer.io agency →